Inventory Management

Real-time inventory with true FIFO cost on every SKU

SellerGuards keeps your FBA and FBM stock in sync with Amazon and layers your own purchase lots on top — so every SKU shows its real cost, how much capital it's tying up, how long it'll last, and the profit it's actually generating.

InventoryFBA · FBMStock value$42,180In-stock SKUs128Low stock6PRODUCTSTOCKINBOUNDAVG COSTROICOVERWireless EarbudsWE-220 · FBA340200$22.0073%41dYoga Mat ProYM-09 · FBM58$9.5064%12dLED Desk LampLD-71 · FBA12696$14.8058%28dSteel Bottle 1LSB-1L · FBA9$7.2041%3d
The inventory list

Every SKU, every channel, in one view

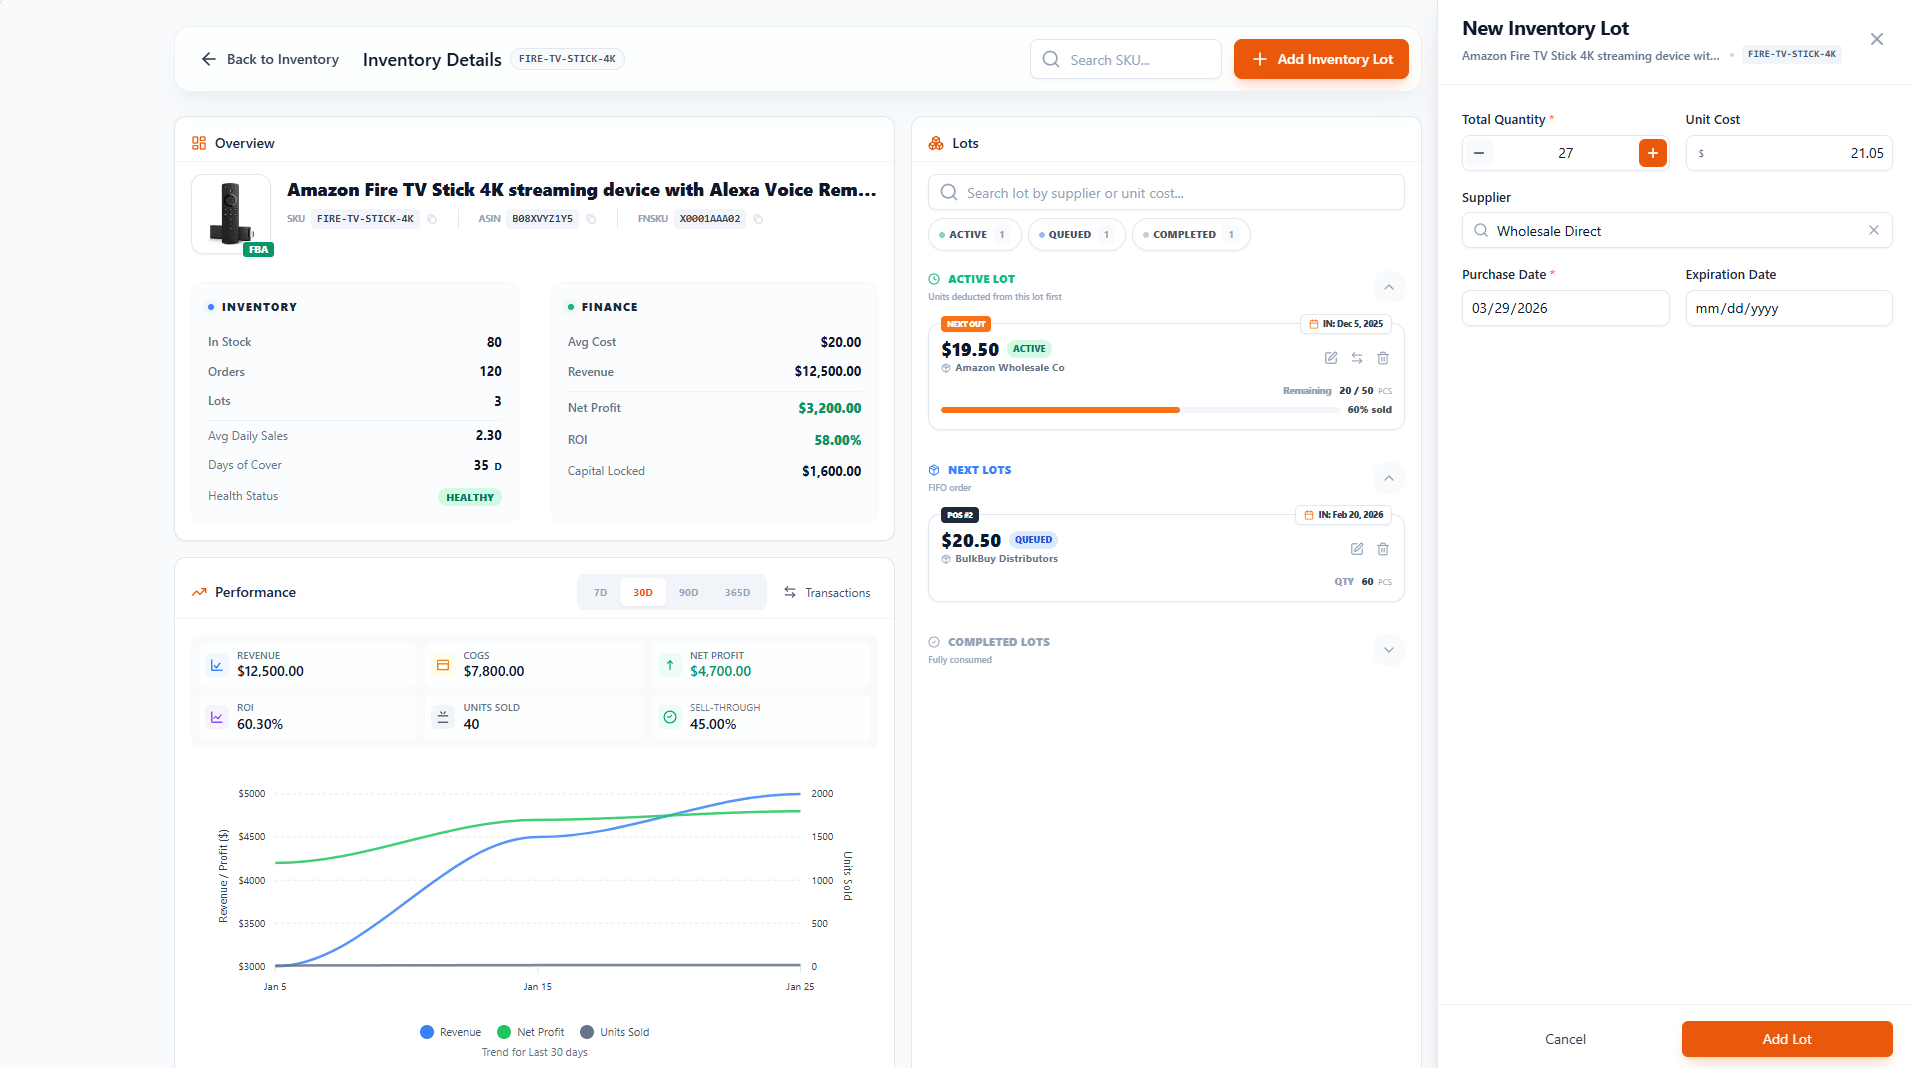
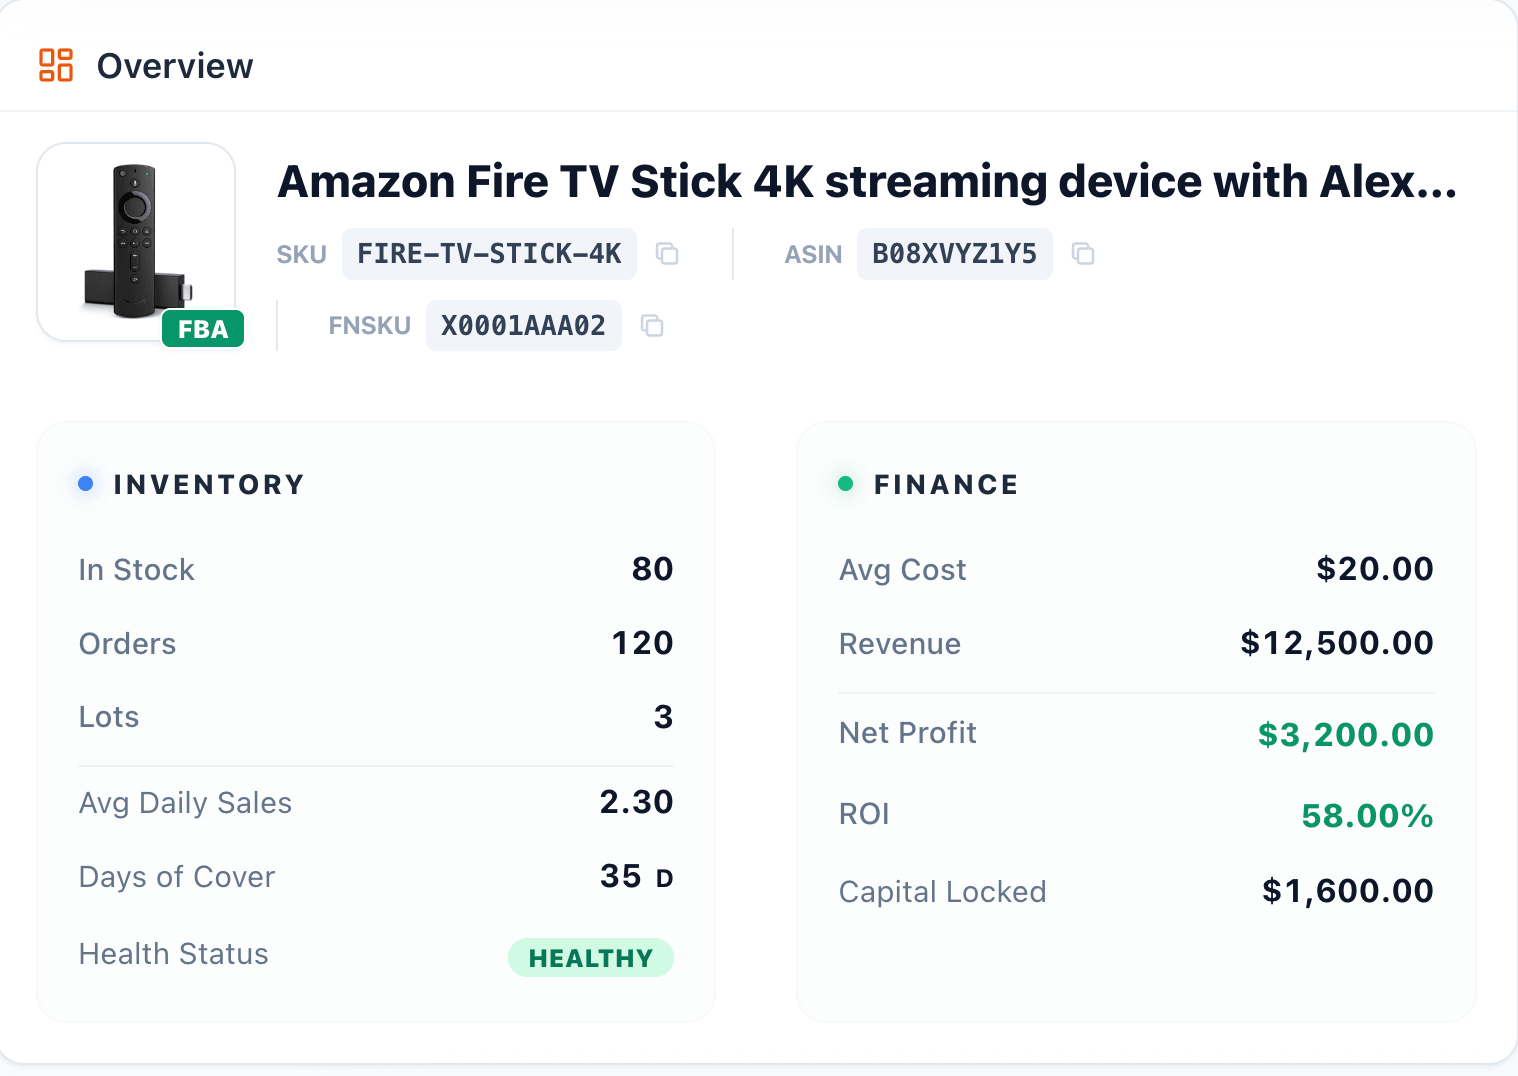
FBA and FBM SKUs sync automatically from Amazon. Each row shows what's on hand, what's on the way, what's reserved, and the average cost behind it — so you can spot stockouts and dead capital at a glance.

SellerGuards inventory list showing FBA and FBM SKUs with in-stock, inbound, reserved, lots, list price and average cost

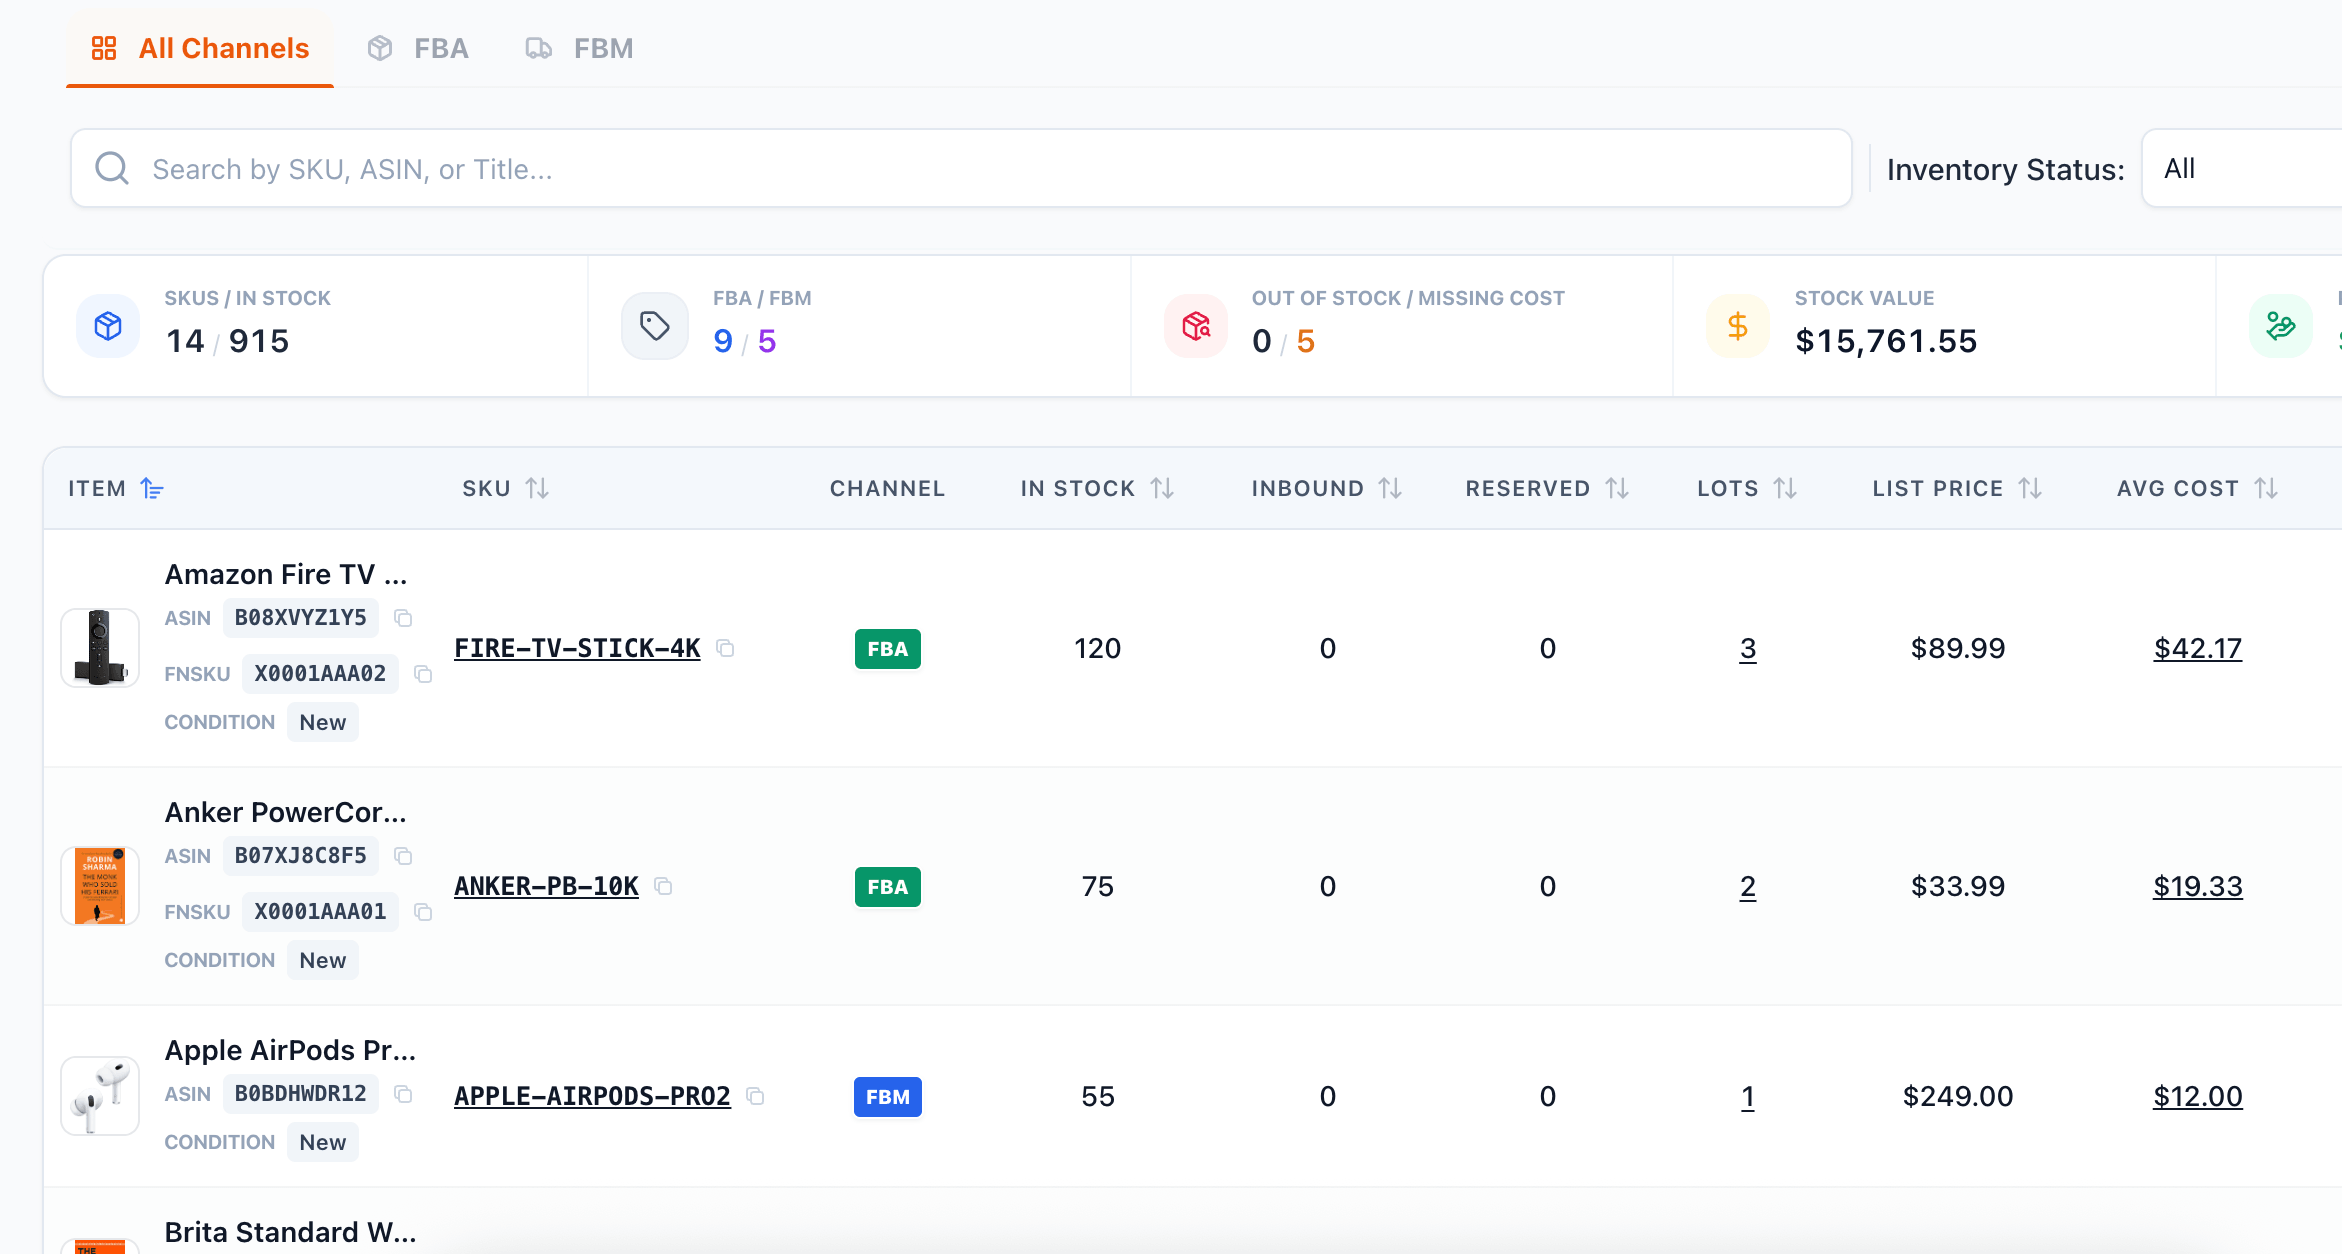
Stock at a glance. In-stock, inbound and reserved units per SKU, plus the number of cost lots and the list price.

FBA & FBM together. Filter by channel, search by SKU / ASIN / title, and filter by inventory status to find exactly what you need.

Real average cost. Avg cost is calculated from your purchase lots, not guessed — and flags SKUs that are still missing cost data.

Portfolio totals. Summary cards roll up SKUs in stock, FBA vs FBM split, out-of-stock counts, and total stock value across your catalog.

Inventory item detail

Click a SKU for the full story

Open any SKU to see its complete picture — an overview of stock and finance, a performance chart over time, and the FIFO lots that drive its cost. Add new purchase lots in a couple of clicks and every cost updates automatically.

SellerGuards inventory item detail page with overview, performance chart, and FIFO lots panel
Inventory item overview card showing in stock, orders, lots, days of cover, avg cost, net profit, ROI and capital locked
Overview

The health of a SKU in one card

The overview pairs the inventory side with the finance side, so you can judge a product's health and profitability without leaving the page.

Inventory side. In stock, orders, lots, avg daily sales, days of cover, and a plain-English health status.

Finance side. Avg cost, revenue, net profit, ROI, and the capital currently locked in this SKU.

Decide fast. Spot slow movers tying up cash and fast movers worth reordering — at a glance.

Performance

See how a SKU trends over time

Switch between 7-day, 30-day, 90-day and 365-day windows to watch revenue, profit and units sold move together — and catch a SKU slowing down before it becomes a problem.

Key metrics per period. Revenue, COGS, net profit, ROI, units sold and sell-through for the window you pick.

Trend chart. Revenue, net profit and units sold plotted together so the story is obvious at a glance.

Drill into transactions. Jump straight to the underlying orders behind any period.

Inventory item performance panel showing revenue, COGS, net profit, ROI, units sold and a trend chart across 7D, 30D, 90D and 365D
FIFO lots

Every unit costed to the right purchase lot

Record each purchase as a lot — supplier, unit cost, quantity, purchase and expiration dates. SellerGuards consumes them oldest-first, so cost of goods is true FIFO and your margins stay honest as prices change.

Active, queued & completed

See which lot is selling now, what's next in line, and what's fully consumed — in true FIFO order.

Supplier & unit cost

Each lot keeps its supplier and exact unit cost, with remaining units and a sold-through bar.

Add lots in seconds

Log a new lot with quantity, cost and dates, and every cost and margin recalculates instantly.

Stop guessing what your inventory is worth

Connect Amazon, add your purchase lots, and SellerGuards turns raw stock counts into real cost, capital, and profit per SKU — automatically.

Start Free View Live Demo