Precise
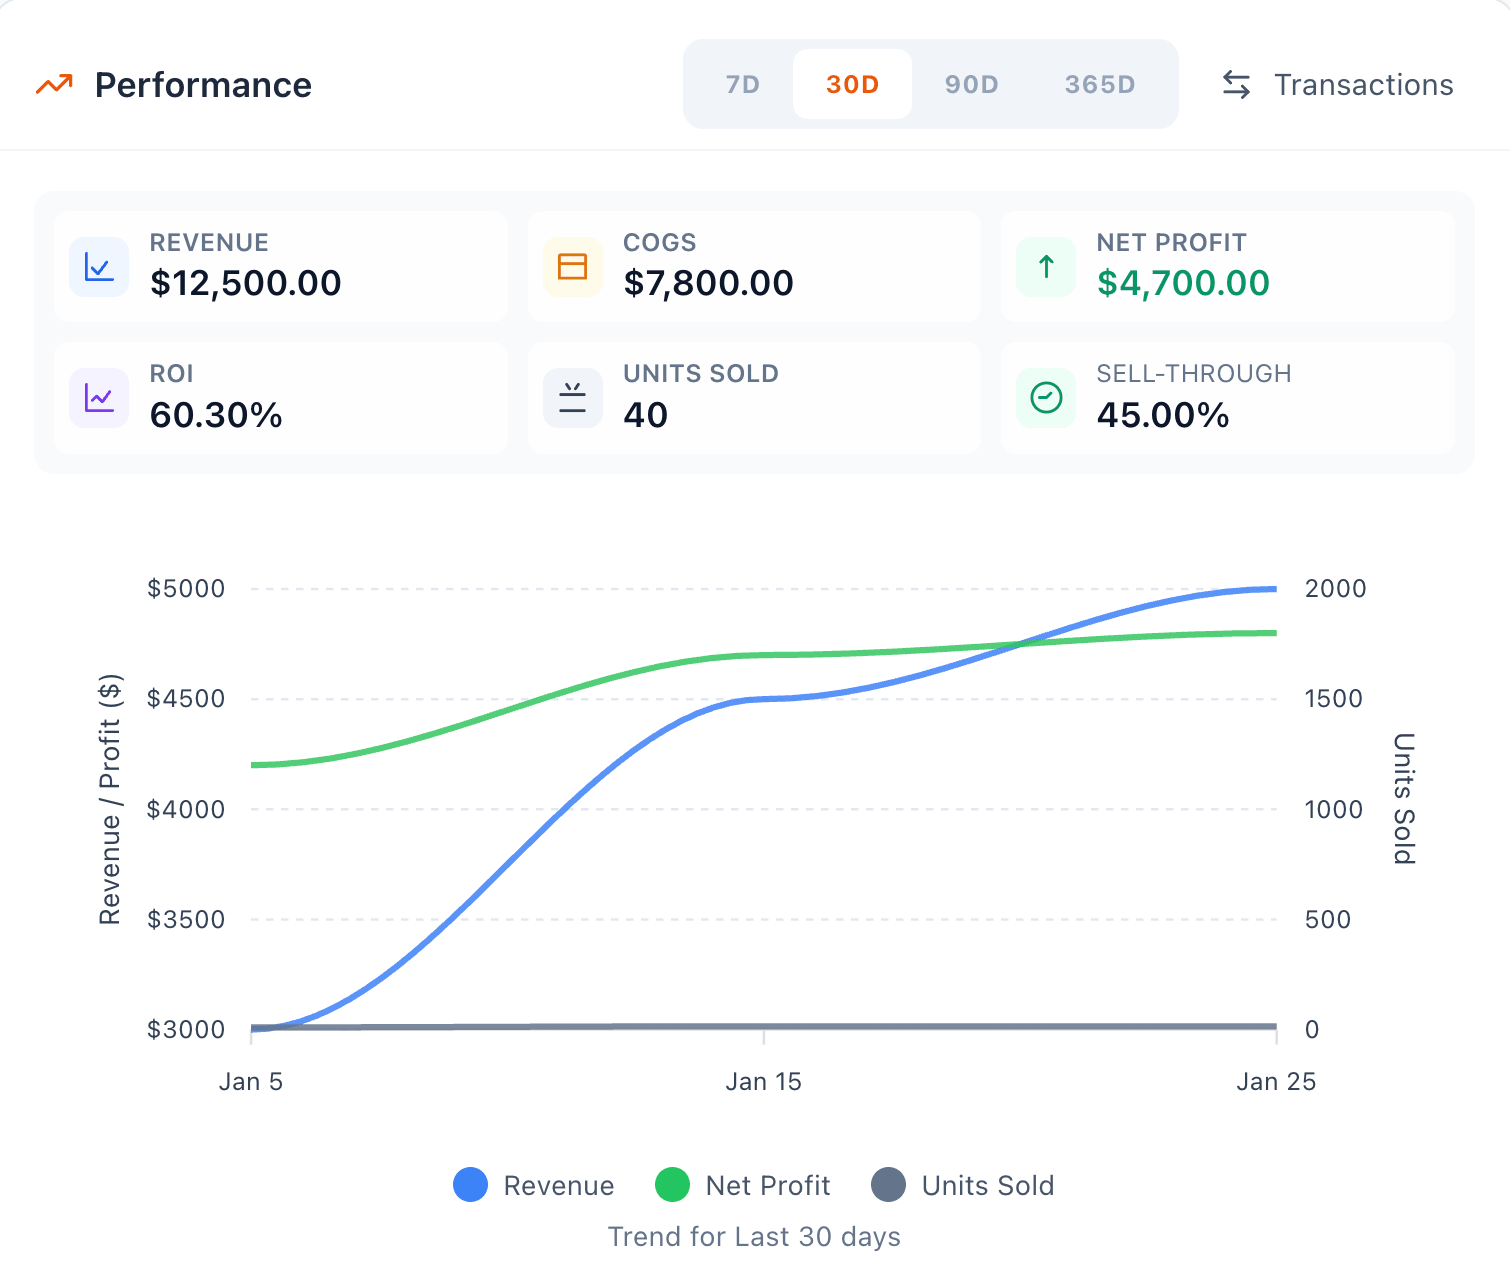
profit analytics and insights
for Amazon sellers
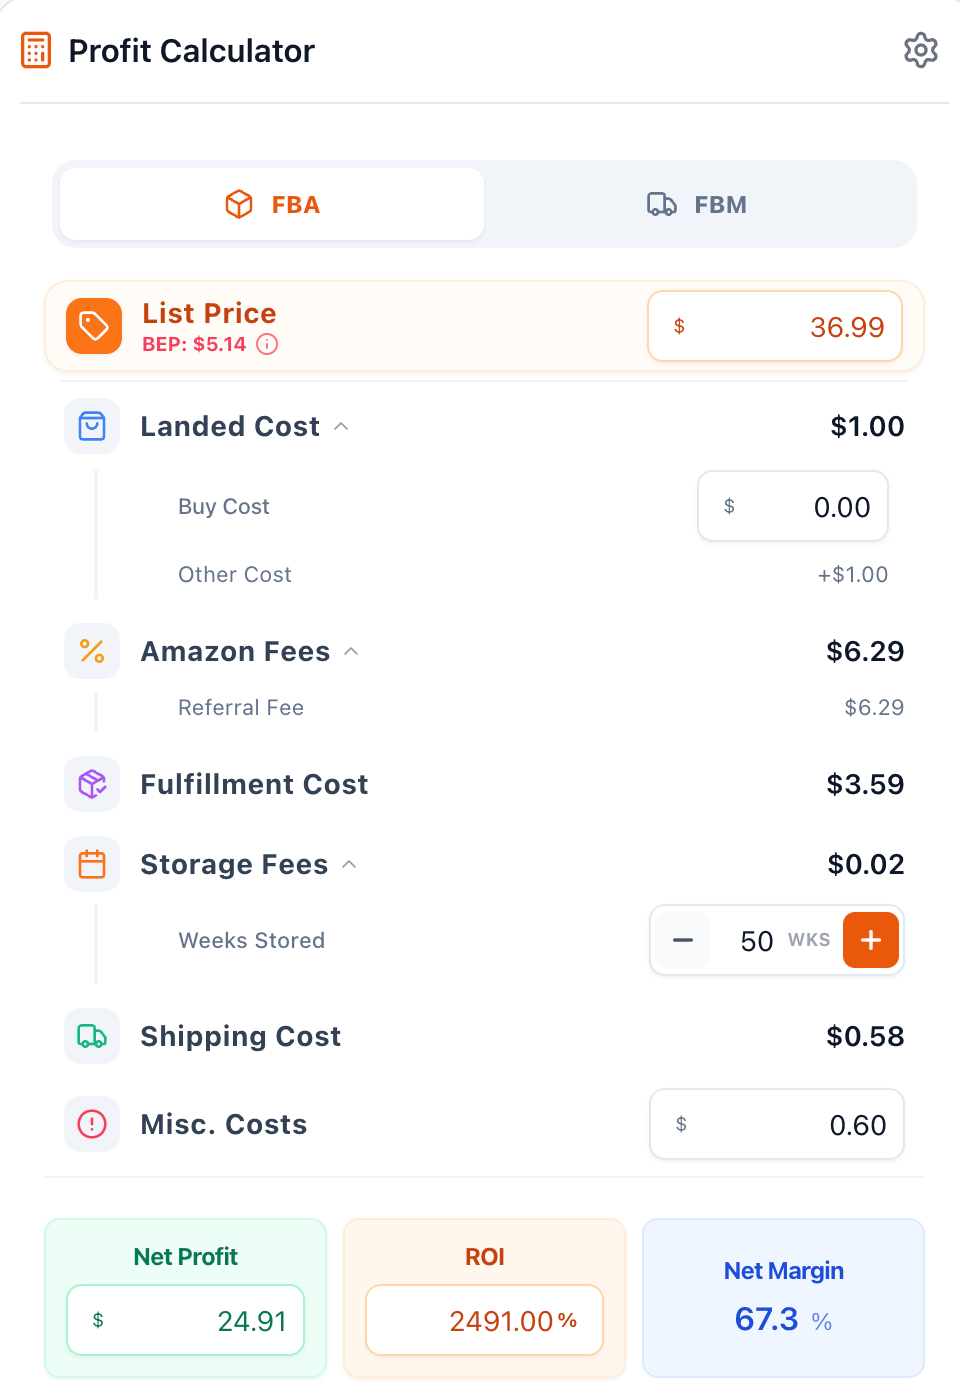
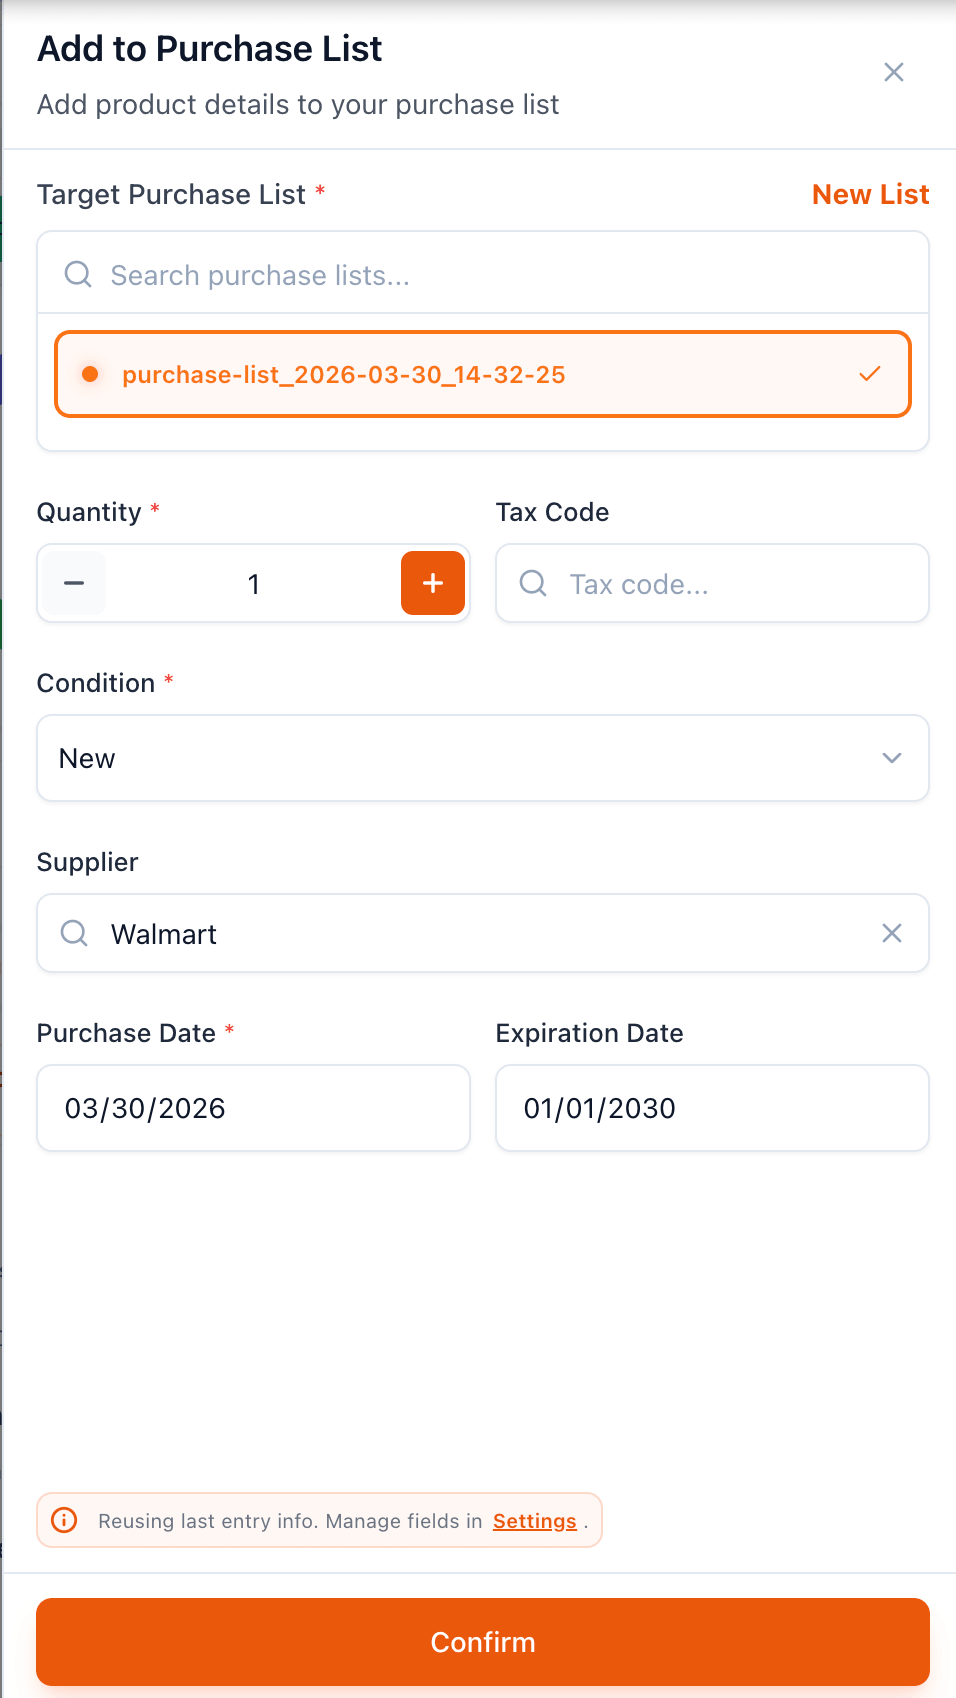
Complete profit analytics, FIFO‑accurate inventory, and the insights that show where every dollar goes — and find the money Amazon owes you.
Built by people who’ve spent 10+ years in Amazon 3d-party tools
We were the core developers behind a well-known Amazon profit-analytics platform — more than ten years building the third-party tools sellers ran their businesses on. Good tools already exist. We’re building SellerGuards because we believe there’s room to do it better, and fairer, for sellers like you.
A Decade in Amazon Tools
10+ years building the Amazon 3rd party software sellers run their business on — we know where Amazon’s data breaks.
Built With Sellers
Shaped by the people who use it. We read every message and build around what sellers actually need.
Honest, Seller Pricing
Start free, then pay just a few dollars a month as you grow — priced for small and mid-size sellers, never more than it needs to be.
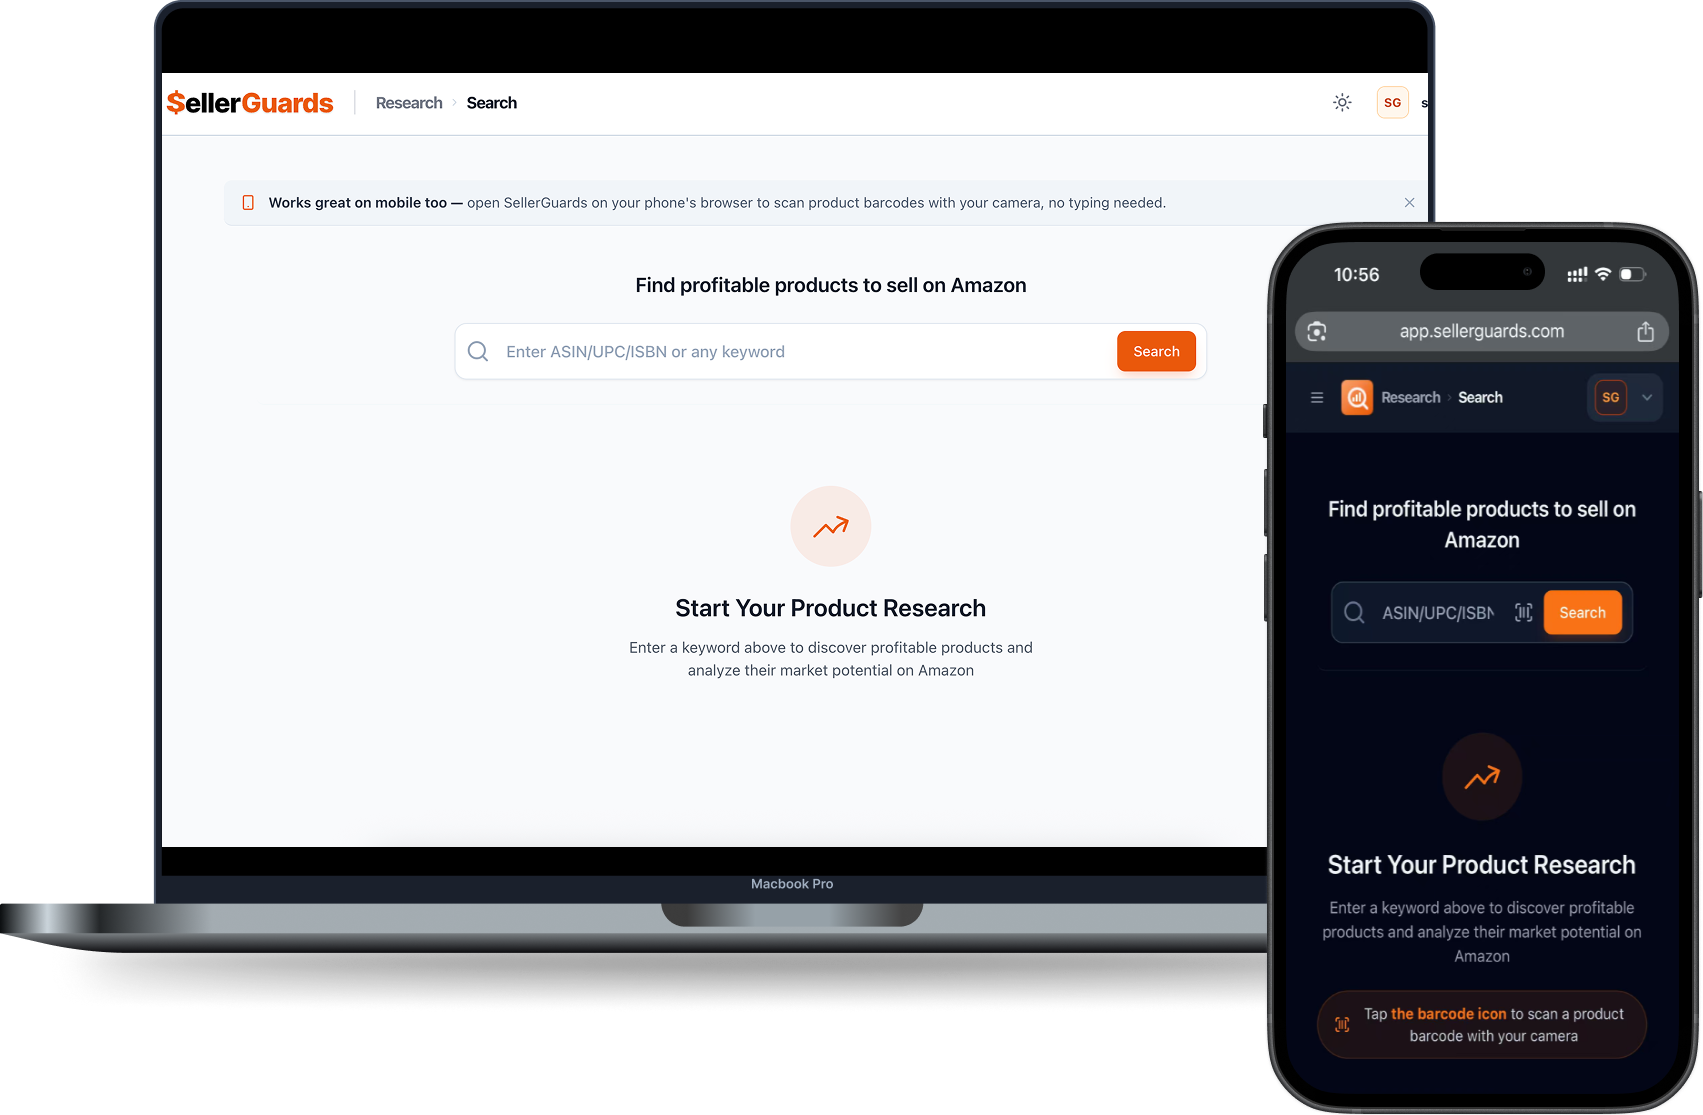
A Joy to Use
A modern app that’s genuinely powerful yet easy to use — beautifully designed, fast, and a world away from the clunky tools sellers put up with.